

IAP-26-064
Restore, re-wet, re-measure, Re-PEAT: Quantitative Assessment of Peatland restoration techniques using time-lapse Electromagnetic Geophysics
Peatlands play a critical role in efforts to combat climate change. Healthy peatlands contain large amounts of soil carbon, but when drained or damaged, oxidisation releases CO2 and methane, turning these vast carbon sinks into major emitters. The UK is one of the most peat-rich countries in Europe with peatlands covering 10-20% of land area, but it is currently estimated than ~80% of this is degraded. Major efforts are ongoing to restore large areas of peatland across the country, in line with net-zero targets. The most crucial process in peatland restoration is re-wetting – raising and maintaining a high-water table to prevent oxidisation, and encourage recovery of key vegetation such as sphagnum mosses.
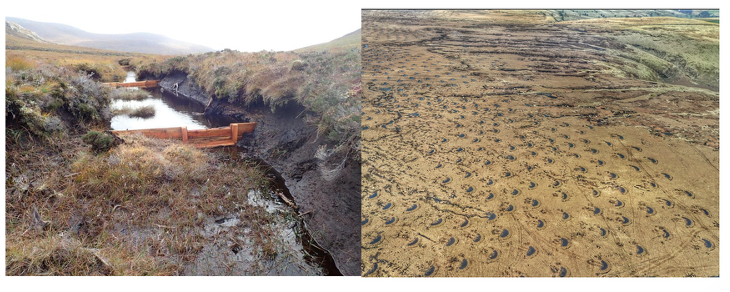
Various strategies are implemented to restore peatlands, but there are limited tools available to quantitively test their effectiveness across large spatial scales. Methods include creating bunds – raised hummocks and sunken hollows to try and retain surface and subsurface water, blocking gulleys to restrict draining water, and trenching to block underground drainage pathways. Key questions need to be assessed to determine how effective restoration efforts have been:
-Spatial Extent: is water retention localised to immediate vicinity, or seen across larger scales?
-Temporal variation: Does the intervention maintain high water tables, in the mid-to-longer term?
-Optimal design: Are some intervention designs more effective than others?
Traditional environmental monitoring methods such as water table-loggers, dip-wells and soil moisture monitors are costly, intrusive and limited to point measurements, which may not be representative of the wider region, around the intervention.
Geophysical imaging methods have the potential to provide an invaluable tool for quantitively assessing restoration practices, across large spatial and temporal scales, due to their ability to measure variations in subsurface parameters linked to changing soil properties. Geophysical prospecting is commonly used to image shallow subsurface properties, such as electrical conductivity and soil thickness, from 10s of meters to hectares. Generally, these measurements provide single snapshots of conditions at a given time. Logistical challenges of accessing remote and rugged peat-land locations present feasibility constraints for many geophysical methods, however light-weight, non-intrusive electro-magnetic induction (EMI) equipment, which maps changes in soil conductivity (sensitive to moisture content), has proven practical in some initial studies of peatland settings [1][2].
However a complexity in analysing electrical conductivity data is isolating the influence of static (e.g. soil type, and peat thickness) and dynamic environmental factors (e.g. temperature, moisture content, and water acidity). Theoretically, repeat measurements over the same area can isolate changes linked to dynamic factors. Benchmarking against traditional environmental monitoring data can then quantify the relative importance of different factors, and isolate parameters of relevance to peatland monitoring (e.g. soil moisture content). There are limited studies investigating temporal EMI over peatland areas. Those that exist leave significant time intervals between repeats (e.g. months[1] to years[2]), in an attempt to explore long-term changes. However this approach has the potential to inadvertently capture, short term variations (such as temperature change over 24 hours or recent rainfall events), that could dominate differences between data repeats, potentially leading to mis-interpretation of signals assumed to demonstrate effective long-term rewetting. Without careful analysis of the scale of variations over shorter time-scales, it is not possible to understand the severity this potential issue poses for longer-term geophysical monitoring.
This project will work to design a reliable methodology for collecting repeat EMI data, for use in long-term subsurface monitoring, and to test the feasibility of the approach for assessing the spatial and temporal effectiveness of peatland restoration strategies. The student will collect repeat hectare-scale EMI measurements over peatland sites undergoing active restoration across a range of time-intervals, alongside traditional environmental monitoring data to benchmark results. This will allow assessment of the following key science questions:
-Which environmental factors dominate changes in soil conductivity signals in peatlands?
– Over what time-scales do these operate, and could short period variations mask long-term changes?
-What is the optimal technique to isolate different contributing environmental factors across space and time?
Click on an image to expand
Image Captions
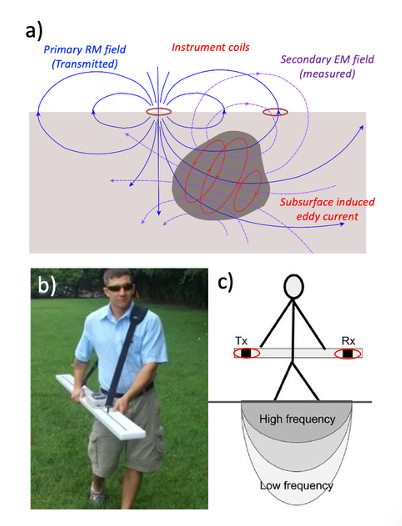
Figure 1. Examples re-wetting interventions in degraded peatlands. Left – gulley blocking, right – bund creation,Figure 2. a) Illustration of the process of electro-magnetic induction in a subsurface conducting body, recorded by a two-coil electro-magnetic (EM) surveying instruments at the surface. b) Example of the Geophex Ltd. GEM2 ski multi-frequency EM instrument (Figure from Geophex.com) c) Example of variable depth penetration achieved by varying the frequency of the input AC current in instruments (adapted from Figure 2 in Blanchy et al., (2024)).
Methodology
1) Electro-Magnetic Induction (EMI) subsurface imaging at Peatland Field Sites:
EMI instruments use alternating electro-magnetic (EM) fields, (with different frequencies providing different depth sensitivities) emitted from a transmitter coil, while a receiver coil records the response of subsurface conductors, which produce their own induced EM fields. This technique, used in conjunction with precise GPS positioning, allows rapid mapping of changing subsurface apparent electrical conductivity across large areas. The student will work with Peatland restoration charities and geophysical surveying partners to collect repeat EMI data across study sites with restorative interventions. Repeats will be taken across different time intervals to explore the impact of temporal variations and assess the validity of long-repeat time measurements. The student will then use inversion software emagpy[3] to generate models of subsurface conductivity, supported directly by the software developers.
2) Collection of Environmental Bench Marking Data:
Bench-mark monitoring of environmental parameters is key for valid interpretation of geophysics subsurface models. Thus the student will have access to high temporal resolution measurements from standard environmental monitoring approaches for bench-marking, including:
-soil temperature, moisture and conductivity
-Conductivity of ground water
-Water table depths
-Precipitation data
3) Laboratory calibrations: electrical conductivity – moisture content:
In much geophysical surveying, conductivity changes are used as a proxy for moisture variation. However pioneering work by the British Geological Survey (BGS) has demonstrated that using lab-based calibration of samples of subsurface material, it is possible to directly map conductivity to Gravimetric Soil Moisture content. This technique has been successfully applied to electrical survey data[4]. Here the student will work with BGS partners to extend use of this this approach to electro-magnetic datasets, using soil samples collected from their study areas, to convert their subsurface conductivity models directly into interpreted soil moisture variation at peatland sites.
4) A Data Science approach to spatio-temporal analysis:
Once a complete time-lapse soil moisture variation dataset has been collected, the student will work to analyse results using data science techniques such as Independent Component Analysis[5] and K-means clustering, that have been successfully applied to characterise other Earth Science spatio-temporal datasets[6]. This will allow non-subjective identification of areas with common characteristics in space (e.g. areas of increased moisture around interventions), and time (e.g. areas that are sensitive to seasonal variation or show stable moisture changes long-term), to assess effectiveness of rewetting interventions.
Project Timeline
Year 1
Summer 2027: Pre- PhD starting study sites will be set up, environmental equipment deployment, initial short term data collection conducted. The student will be welcome to informally contribute to the field data collection prior to their formal start date if there is an interest, but this is not mandatory.
-Bi-monthly repeat data collection trips will aim to capture long term-trends
-Collection of soil samples, and lab-based work to produce soil moisture – electrical conductivity calibration curves
-Set up workflow for data analysis including inversion and mapping to soil moisture
-Start preparing paper 1 on an optimised strategy for time-lapse EM monitoring in Peatlands
Year 2
-Communication of initial results with peatland restoration partners
-Continued paper 1 writing
-Continued bi-monthly data collection trips will ensure consistency of annual variations
-On-going analysis of all field data to produce temporal data of soil moisture variation over time
-Comparison of EM results to other geophysical methods being explored for peatland applications by collaborators – contribution to overview/comparison paper 2
Year 3
-Application of data science approaches to explore the full temporal data set
-Paper 3: writing of result analysis and effectiveness of rewetting strategies
-Start of thesis writing
Year 3.5
-Thesis and paper 3 writing
Training
& Skills
This project will suit students interested in developing a broad set of new skills, supported by the diverse supervisory team. This will include experience of field based geophysical surveying, as well as laboratory work and developing computing based analysis skills in terms of geophysical inversion and application of data science approaches. Training on the practical use of equipment in the field, application of inversion software, generating laboratory calibrations and data science methods will be provided by various members of the supervisory team and project collaborators, including industry partners from Terradat geophysical surveying, the British Geological Survey and expert researchers from international institutions.
Training in a wider range of important skills (e.g. presentation skills, paper/thesis writing) will be provided by the Department of Earth Sciences at Durham University, and the student will also benefit from cross-disciplinary training provided as part of the IAPETUS DTP.
CASE partners Terradat will provide a 3 month internship, for the student to experience work in a professional geophysical surveying company, where they will be introduced to numerous other geophysics methods of subsurface imaging.
The student will have opportunities to work with partners in the UK and internationally and will attend national and international scientific meetings to their present results. We aim to see all students publish at least two papers in leading scientific journals during their PhD. Upon completion, the student will be well equipped for a career in academia or in a range of industries.
References & further reading
[1] Henrion et al., (2024). Mapping and monitoring peatlands in the Belgian Hautes Fagnes: Insights from Ground-penetrating radar and Electromagnetic induction characterization. Geoderma Regional, 37, e00795.
[2] Kowalczy et al., (2025). Application of the electromagnetic conductivity method in peatland investigation. Acta Geophysica, 73(6), 5629-5644.
[3] McLachlan, P., Blanchy, G., & Binley, A. (2021). EMagPy: Open-source standalone software for processing, forward modelling and inversion of electromagnetic induction data. Computers & Geosciences, 146, 104561.
[4] Chambers et al., (2014). 4D electrical resistivity tomography monitoring of soil moisture dynamics in an operational railway embankment. Near Surface Geophysics, 12(1), 61-72.
[5] Ebmeier (2016). Application of independent component analysis to multitemporal InSAR data with volcanic case studies. JGR: Solid Earth, 121(12), 8970-8986.
[6] Festa, et al., (2023). Unsupervised detection of InSAR time series patterns based on PCA and K-means clustering. International Journal of Applied Earth Observation and Geoinformation, 118, p.103276.
